Simplify Your World
19 Jul 2017
As a dairy consultant, I really dislike visiting a client cold. By cold, I mean not having an idea of what has happened since my last visit. In a perfect world, I would always prepare for a farm visit by gathering all the data needed, looking it over, and then try to come up with a feel for what to expect the next day. Unfortunately, none of us live in a perfect world.
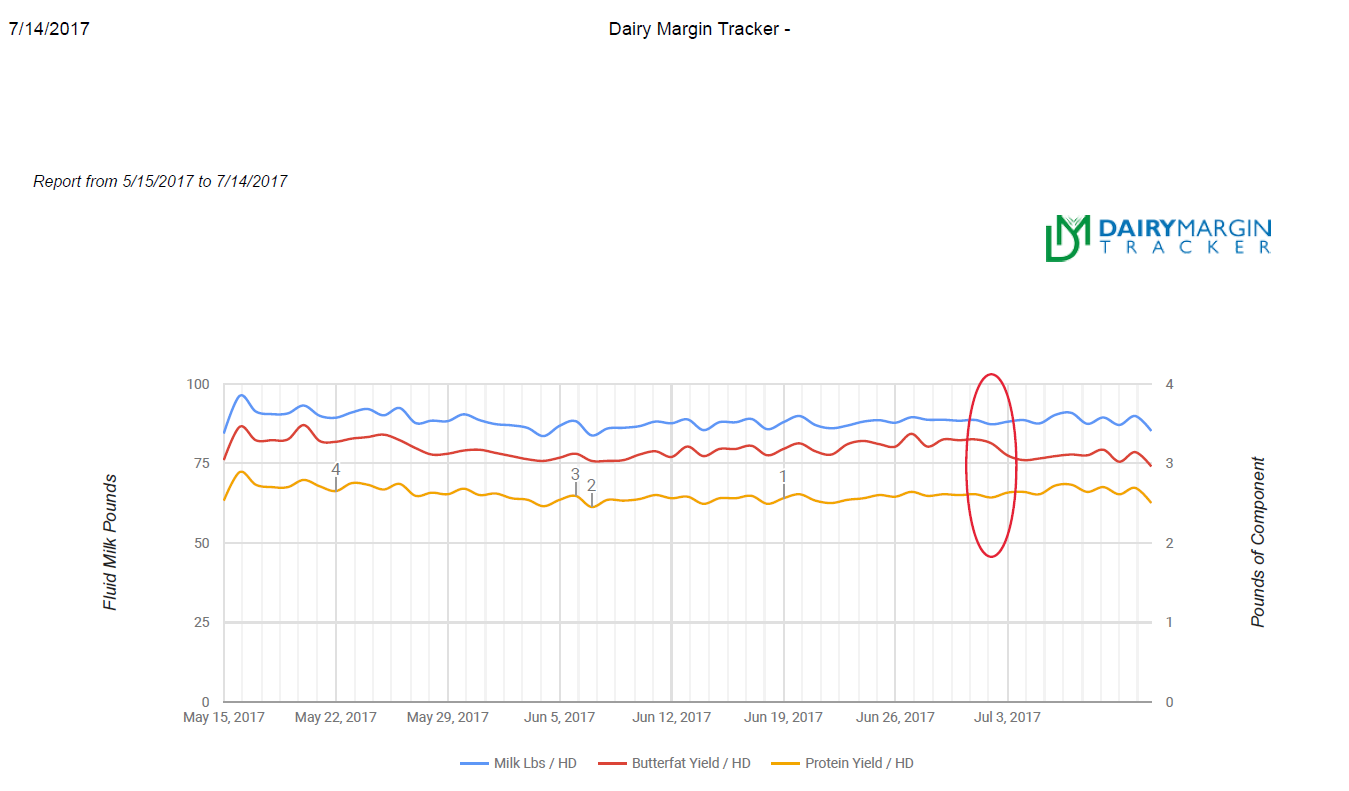
Below is a component yield graph for a farm using the Tracker Tool™ . Notice that I've highlighted July 2. For some reason BF yield has dropped considerably, but milk yield hasn't really changed.
In my perfect world, I would have scoped this out the night before and would have a plan on how to address this. In my real world, I may actually have pulled off the side of the road a couple of miles from the farm to take a quick look at what is going on.
So how can the Tracker Tool help now?
From my phone, I would bring up the Process Change Report below- Keep in mind, Dairy Margin Tracker
is optimized to work on any device. I generated this report on my desktop, but it looks fine on a
smartphone.
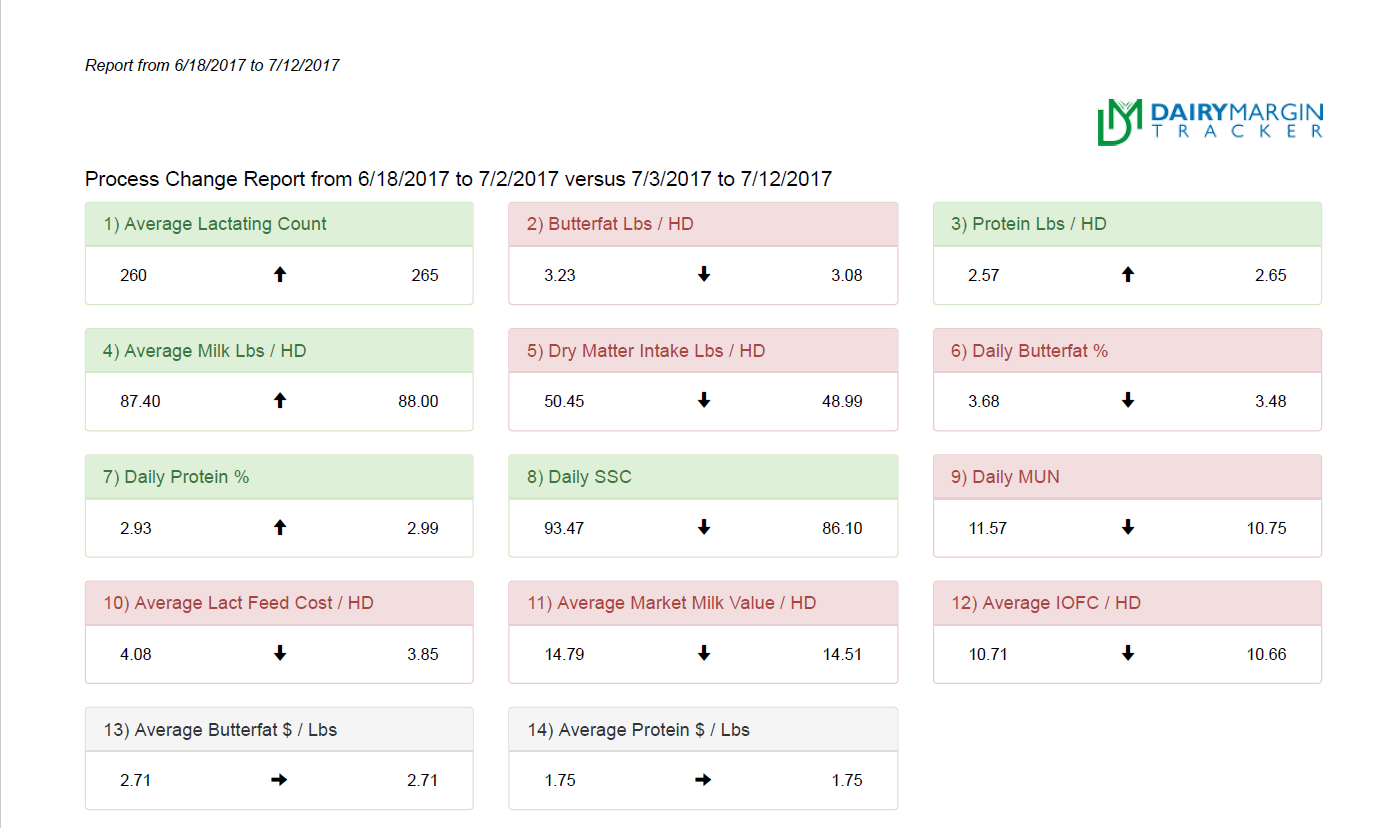
Just taking a quick look, of course BF dropped, but DMI dropped over 1.5#. It should not be too hard to figure out what caused this.
The really nice thing, note that milk production didn't change, it actually went up a smidge. You could very well be looking at a solution to a problem the dairyman didn't even know he had...yet.
If you want to put the Tracker Tool™ to work for you, give me a call.
Thanks,
Kelly
[email protected]
517.605.7278